
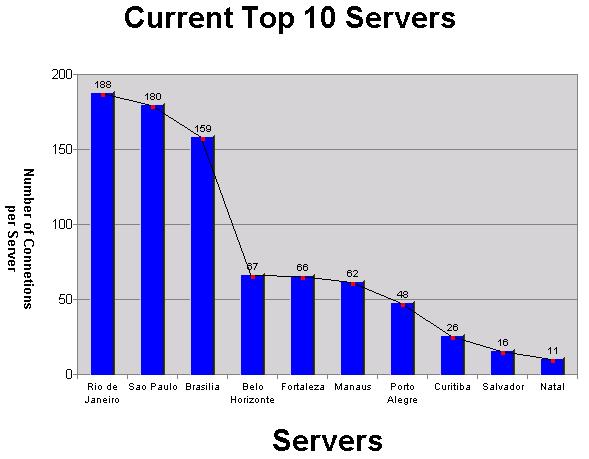
This is a bar chart combined with a graph, which tells you about the top 10 servers. The number of connections per servers are indicated on the vertical axis and the cities are indicated on the horizontal axes. The city with the most connections per server is Rio de Janeiro and the city with the least connections per server in the top ten is Natal. The graph decreases from left to right, because the top ten is arranged that way. Remarkable is the crash from the number of connections per server between the third city Brasilia and the fourth city Belo Horizonte.

1 comment:
"crash" is not correct: the (sharp) drop
Post a Comment